The Supply-Demand Engine at the Core
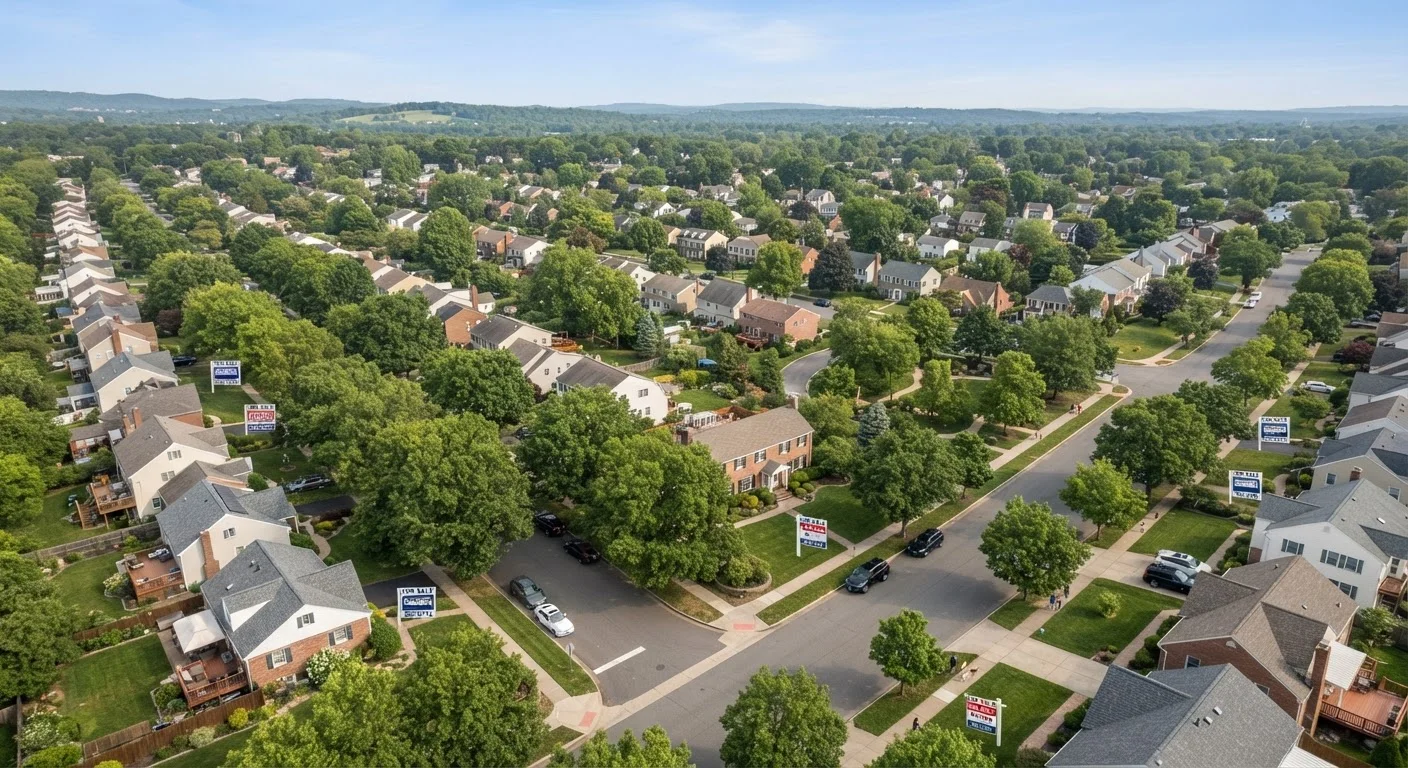
At its most fundamental level, home prices behave like prices in any market: when more people want to buy than there are homes available, prices rise. When supply outpaces demand, prices soften. But the housing market is far less fluid than, say, a stock exchange. Homes take years to build, land is finite, and sellers often have the luxury of waiting - which is why price corrections in real estate tend to be slower and less dramatic than in other asset classes.
Housing inventory - the total number of homes listed for sale at any given time - is one of the most closely watched indicators of market conditions. When inventory falls below roughly three months of supply (meaning it would take three months to sell all listed homes at the current pace), markets typically favor sellers and prices climb. Above six months of supply, buyers generally gain negotiating power.
~3 months
Supply level that signals a seller's market
Industry analysts at the National Association of Realtors have long used a six-month supply benchmark to distinguish balanced markets from seller- or buyer-favoring conditions.
12-24 months
Typical permit-to-occupancy timeline for new homes
According to U.S. Census Bureau construction data, the time between permitting and completion for single-family homes commonly ranges from one to two years.
~$300/mo
Payment increase per $100K loan when rate rises 3 pts
Illustrative calculation based on standard amortization; actual amounts vary with loan term, credit profile, taxes, and insurance.
How Mortgage Rates Shape Buyer Demand
Few forces move the housing market as quickly as shifts in mortgage interest rates. When rates rise, the monthly payment on a given loan amount increases, effectively shrinking how much home a buyer can afford. A buyer who qualifies for a $400,000 mortgage at 4% may only qualify for roughly $320,000 at 7% - a meaningful reduction in purchasing power that ripples across price points.
This mechanism helps explain why periods of very low interest rates - such as those seen in 2020 and 2021 - tend to accelerate home price growth. More buyers can afford more home, intensifying competition for a limited supply. Conversely, when rates rise sharply, demand can cool, moderating price growth or causing modest declines in some markets. The effect, however, is rarely uniform: markets with severe supply shortages may see only muted price softening even as rates climb.
Watch Inventory Trends in Your Target Market
Before drawing conclusions from national price reports, look at months of supply data for the specific ZIP codes you're interested in. Local inventory trends often signal where prices are heading better than any national headline. Your real estate agent or local MLS data can provide this information.
Jobs, Wages, and Population Movement
Local economic health is a powerful and durable predictor of home price trajectories. When a metro area adds significant employment - particularly well-paying jobs - it attracts new residents, increases household formation, and drives sustained demand for housing. Cities that have seen strong tech or healthcare sector growth, for example, have frequently experienced above-average price appreciation over extended periods.
Migration patterns amplify these effects. When remote work expanded the geography of where knowledge workers could live, previously secondary markets saw rapid price increases as households relocated from high-cost coastal cities. This dynamic illustrates why regional and ZIP code-level trends can diverge sharply from national averages. A market losing jobs and population faces structurally different price pressures than one gaining both.
Zoning, Permitting, and the Construction Constraint
On the supply side, the ability to build new homes is one of the most consequential - and frequently underappreciated - factors in long-run price levels. Zoning laws determine what types of housing can be built and where. In many high-demand metros, large portions of residential land are zoned exclusively for single-family homes, restricting the density of new construction and limiting supply responses to rising demand.
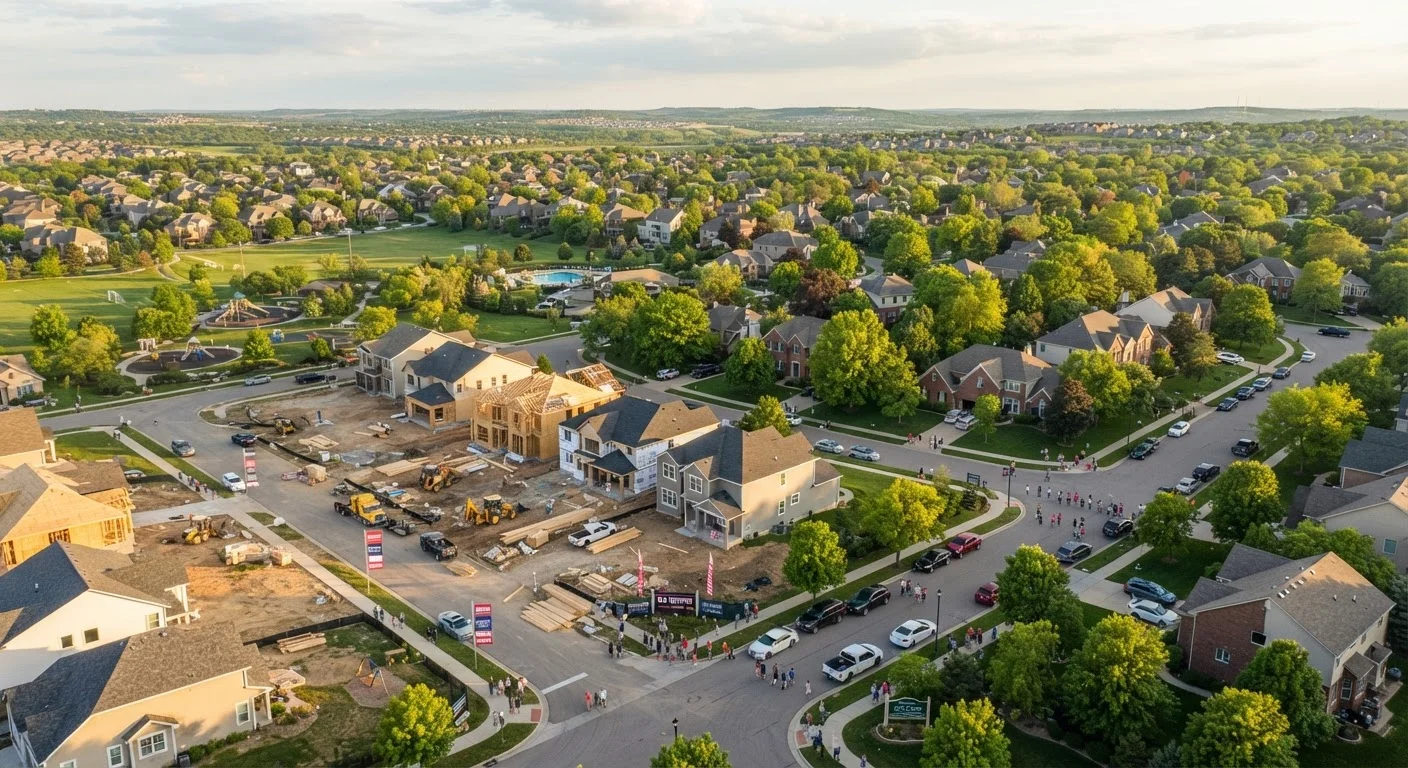
Permitting timelines and construction costs add further friction. Even when demand is high and land is theoretically available, new homes can take 12 to 24 months from permit to occupancy, delaying supply responses to price signals. Rising material and labor costs - which have increased substantially in recent years - can also price out some new construction, further constraining the pipeline of available homes. The result is that supply often lags demand for extended periods, sustaining upward price pressure.
For a broader framework of how these forces interact with broader market indicators, see The Complete Guide to Understanding the U.S. Housing Market.
Reading the Market with Confidence
Understanding these drivers does not mean predicting the market - no one can do that reliably. What it does mean is being able to interpret the information that's already publicly available with greater confidence. Metrics like median sale prices, days on market, and months of supply carry more meaning when viewed through the lens of the forces described above.
Whether you're navigating the home purchase process or simply trying to understand what your current home may be worth in a shifting market, grounding your perspective in these structural forces - rather than headline noise - is the most reliable starting point. Price movements are rarely random; they reflect the cumulative weight of supply, demand, financing costs, and local economic conditions playing out in real time.
This article is for general informational and educational purposes only and does not constitute financial, investment, or real estate advice. Consult a qualified real estate professional for guidance specific to your situation.